Hi
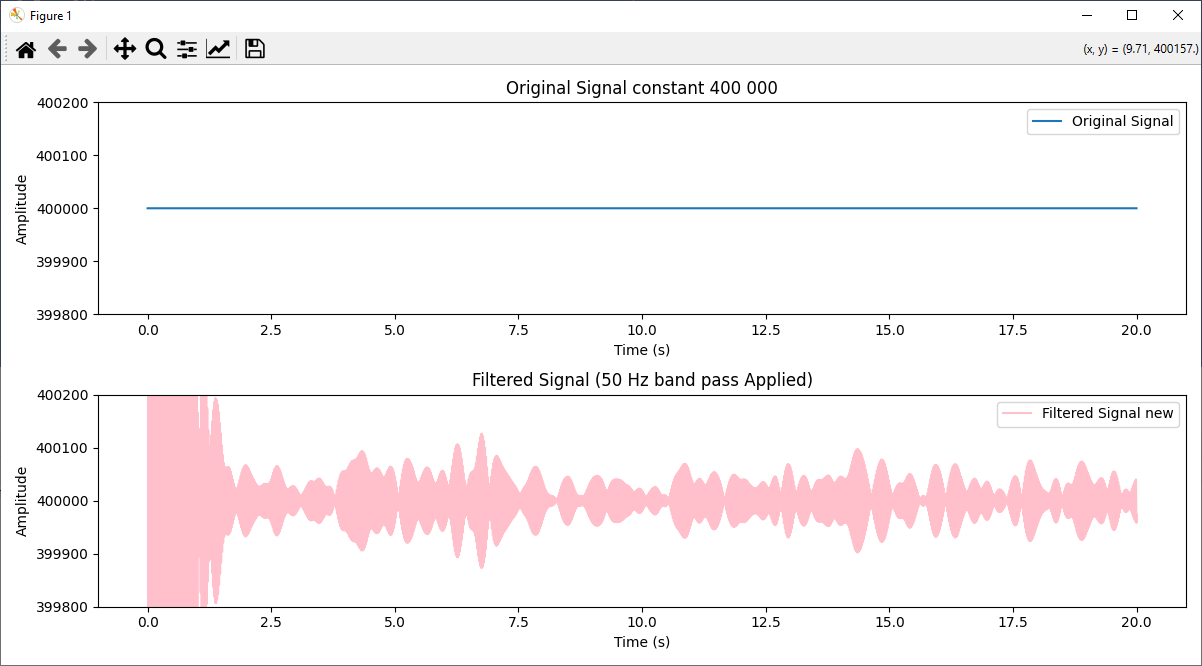
ich habe ein Bandstop um 50 Hz. Wenn der Input des Filters eine Konstante ist(400000) fängt der output zu oszilieren. Warum? geht es da um "infinite impulse response"? Oder Quantisierungs Effekte?
hier noch der python code dazu: import numpy as np import matplotlib.pyplot as plt from scipy.signal import iirnotch, filtfilt, lfilter from scipy.signal import iirnotch, freqz, lfilter, impulse, iirfilter
Parameters
fs = 1000 # Sampling frequency (Hz) duration = 20 # Signal duration in seconds
Generate the IIR notch filter
cutoff = 50 lc_freq = (cutoff - 2) / 500 hc_freq = (cutoff + 2) / 500 b_new, a_new = iirfilter(5, [lc_freq, hc_freq], btype='bandstop', ftype='butter')
Generate the sinusoidal signal
t = np.linspace(0, duration, int(fs * duration), endpoint=False) original_signal = [400000] * (fs * duration)
Apply the notch filter
filtered_signal = lfilter(b_new, a_new, original_signal)
Plot the results
plt.figure(figsize=(12, 6))
Unfiltered signal
plt.subplot(2, 1, 1) plt.plot(t, original_signal, label='Original Signal') plt.title('Original Signal constant 400 000') plt.xlabel('Time (s)') plt.ylabel('Amplitude') plt.ylim(400000-200, 400000+200) plt.legend()
plt.subplot(2, 1, 2) plt.plot(t, filtered_signal, label='Filtered Signal new', color='pink') plt.title('Filtered Signal (50 Hz band pass Applied)') plt.xlabel('Time (s)') plt.ylabel('Amplitude') plt.ylim(400000-200, 400000+200) plt.legend() plt.tight_layout() plt.show()
-
 filter.png
(54 KB)
filter.png
(54 KB)