-
 Bild
Bild
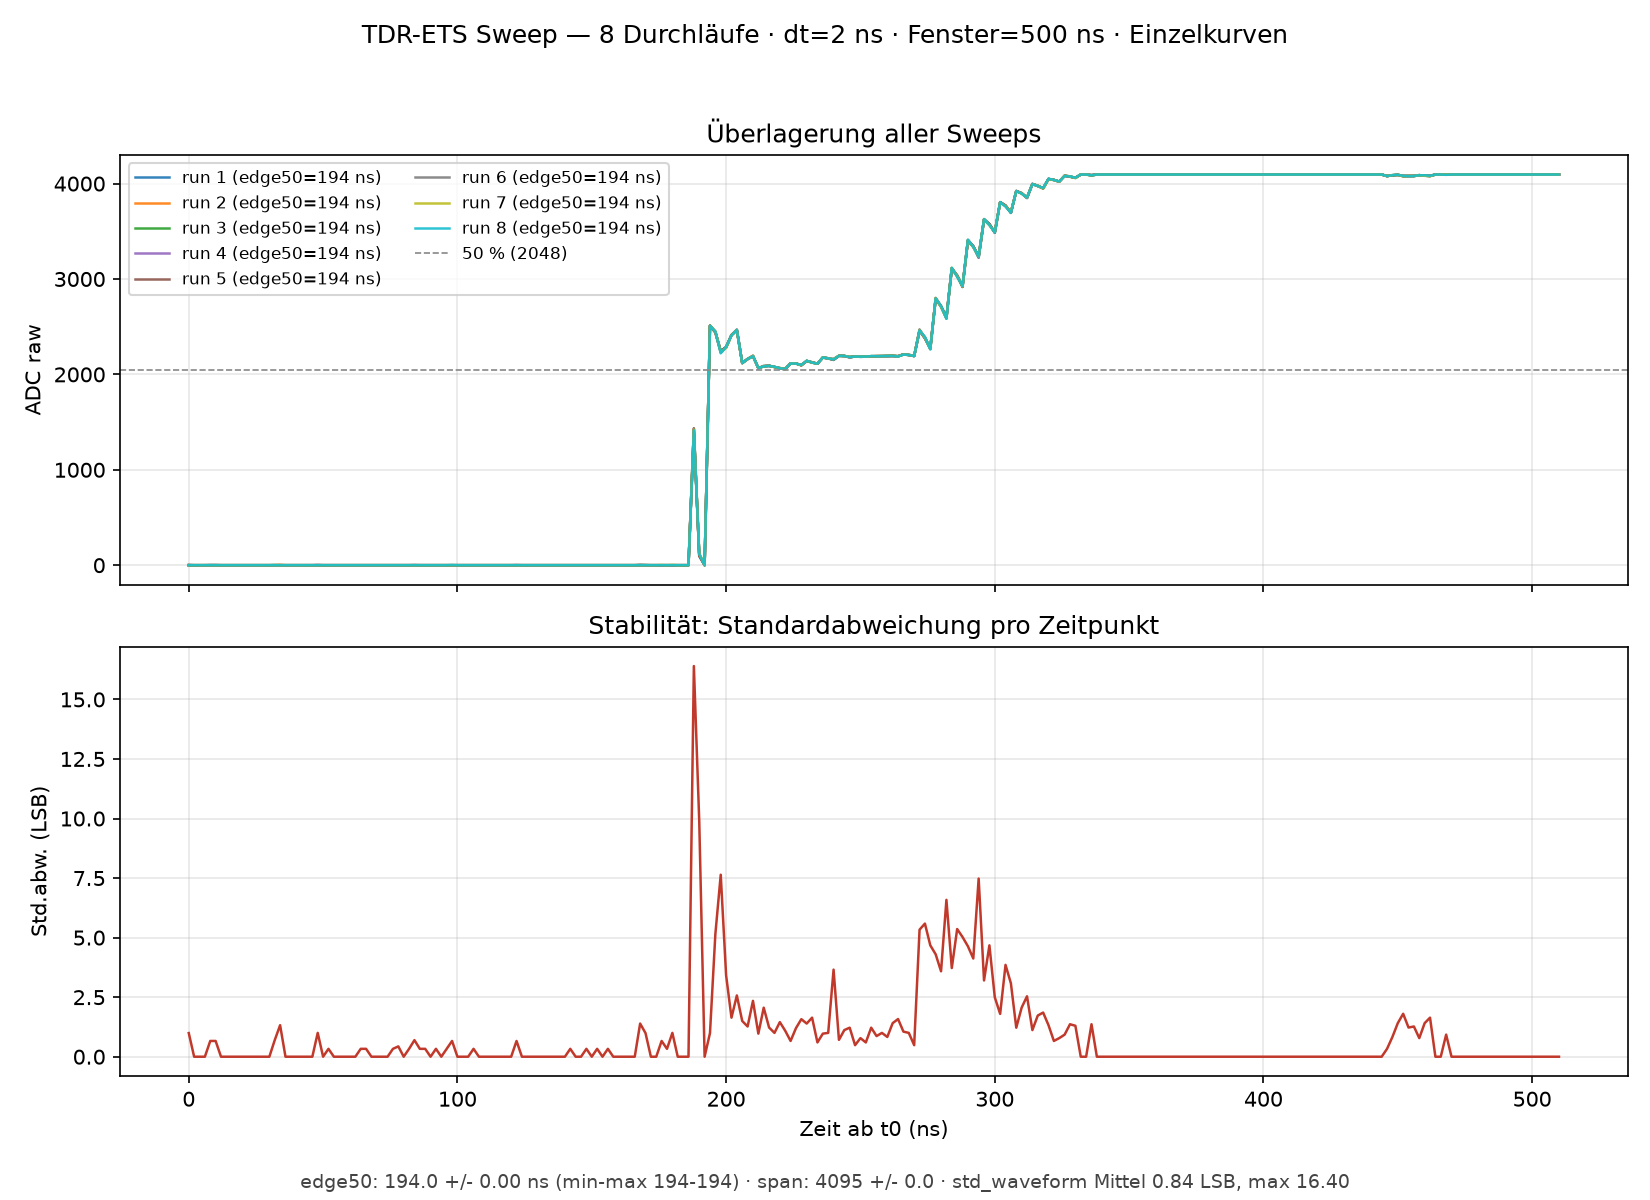
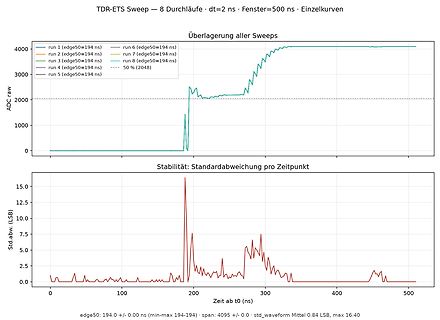
Diagramme einer TDR-ETS Messung
TDR-ETS Sweep – 8 Durchläufe · dt=2 ns · Fenster=500 ns · Einzelkurven Überlagerung aller Sweeps run 1 (edge50=194 ns) run 2 (edge50=194 ns) run 3 (edge50=194 ns) run 4 (edge50=194 ns) run 5 (edge50=194 ns) run 6 (edge50=194 ns) run 7 (edge50=194 ns) run 8 (edge50=194 ns) 50 % (2048) ADC raw Stabilität: Standardabweichung pro Zeitpunkt Std.abw. (LSB) Zeit ab t0 edge50: 194.0 +/- 0.0 ns (min-max 194-194) · span: 4095 +/- 0.0 · std_waveform Mittel 0.84 LSB, max 16.40
-
 Bild
Bild
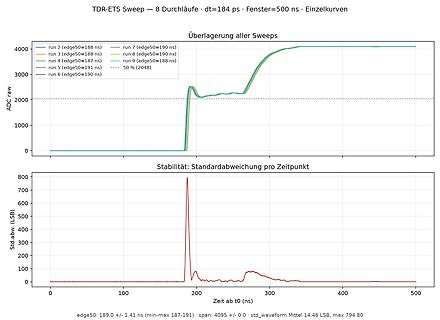
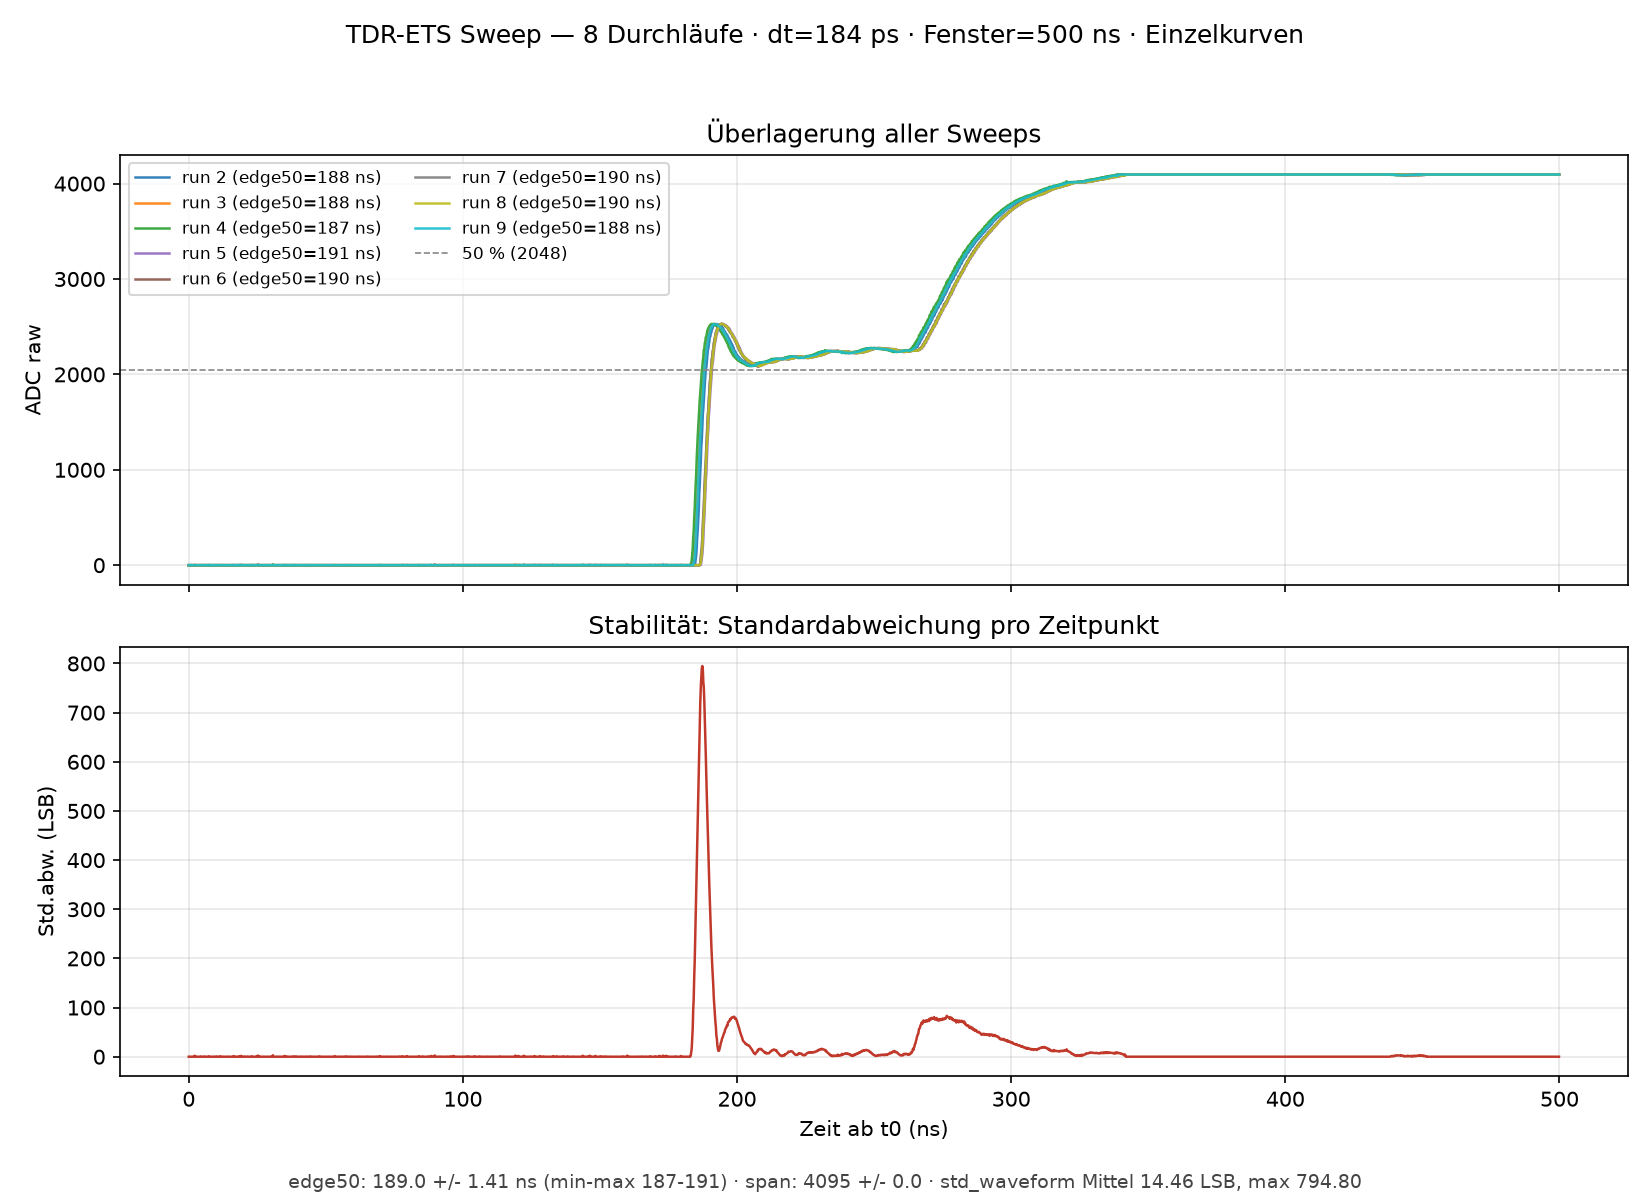
TDR-ETS Sweep Messkurven und Standardabweichung
ns) 50 % (2048) ADC raw Überlagerung aller Sweeps Stabilität: Standardabweichung pro Zeitpunkt Std.abw. (LSB) Zeit ab t0 (ns) edge50=189.0 +/- 1.41 ns (min-max 187-191) · span= 4095 +/- 0.0 · std_waveform 14.46 LSB, max 794.80