R: Wie Sammel-Grafik beschriften?

Persönliche Seite #2720509
Lesenswert?

Hi, hab heute meine ersten Gehversuche mit R gemacht. Auch wenn mir die 
Sprache selber ziemlich chaotisch erscheint, bin ich dank reichlich 
vorhandener Beispiele einigermassen fix vorangekommen.

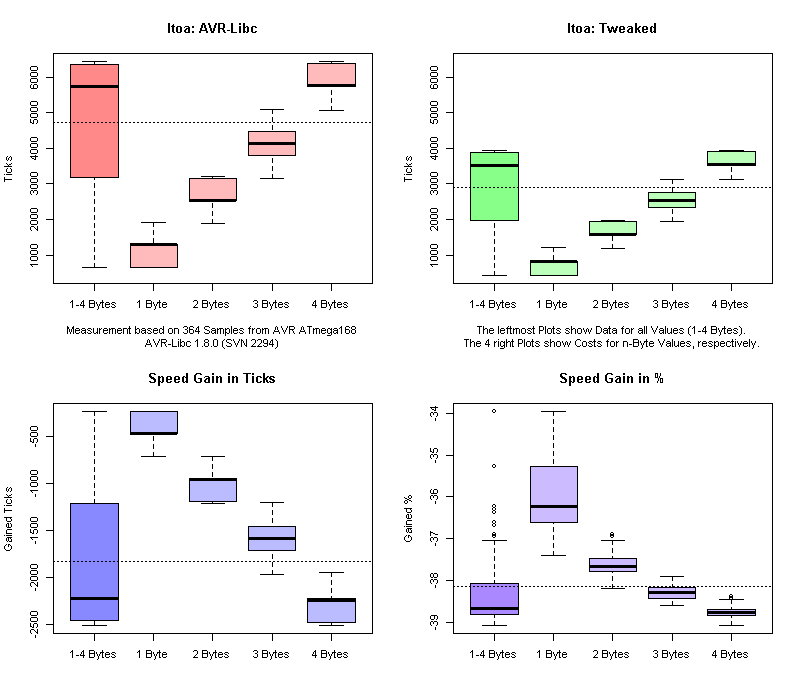
Im Anhang ist ein 2x2 Boxplot. Die einzelnen Plots lassen sich einfach 
beschriften, aber ich hab keine Möglichkeit gefunden, eine 
Gesamtüberschrift/Erklärung für die gesamte Grafik hinzubekommen.

Ich hab versucht, ein Layout mit 5 Boxen zu verwenden:
1
 111
2
 ---
3
 2|3
4
 -+-
5
 4|5
6

7
 layout (matrix (c(1,1,2,3,4,5), 3, 2, byrow = TRUE), heights=c(1,4,4))
8
 plot.new()
9
 title (main="Text")

und Titel/Erklärung in $1 unterzubringen. Aber die Ränder werden so dick 
daß R ständig einen Fehler wirft, so daß ich diesen Ansatz aufgegeben 
hab.

Wie bekommt man da noch ne Gesamtüberschrift hin?

Hier noch das R-Skript
1
bits2bytes <- function (n) { max (1, (n+7) %/% 8) }
2

3
gmean <- function (x) { exp (mean (log(x))) }
4

5
bytestat <- function (x, col)
6
{
7
    b1 = x[(x$Bytes==1),][col];
8
    b2 = x[(x$Bytes==2),][col];
9
    b3 = x[(x$Bytes==3),][col];
10
    b4 = x[(x$Bytes==4),][col];
11
    c (x[col], b1, b2, b3, b4)
12
}
13

14
###########################################
15

16
func = "ltoa"
17

18
file_name = paste (func, ".data", sep="")
19
plot_name = paste (func, ".png", sep="")
20

21
x <- read.table (file_name, header=TRUE)
22

23
###########################################
24

25
colnames(x)[1] = "Old"
26
colnames(x)[2] = "New"
27

28
x$Gain     <- x$New - x$Old
29
x$"Gain %" <- 100 * x$Gain / x$Old
30
x$Bytes    <- factor (sapply (x$bits, bits2bytes))
31

32
###########################################
33

34
xlabels = c("1-4 Bytes", "1 Byte", "2 Bytes", "3 Bytes", "4 Bytes")
35

36
note1 = paste ("Measurement based on ", length (x$Old), " Samples",
37
               " from AVR ATmega168\nAVR-Libc 1.8.0 (SVN 2294)",
38
               sep ="")
39
note2 = paste ("The leftmost Plots show Data for all Values (1-4 Bytes).\n",
40
               "The 4 right Plots show Costs for n-Byte Values, respectively.",
41
               sep="")
42

43
titleOld = paste (func, ": AVR-Libc", sep="")
44
titleNew = paste (func, ": Tweaked", sep="")
45

46
red   = c("#ff8888", rep ("#ffbbbb", times=4))
47
green = c("#88ff88", rep ("#bbffbb", times=4))
48
blue  = c("#8888ff", rep ("#bbbbff", times=4))
49
blue2 = c("#aa88ff", rep ("#ccbbff", times=4))
50

51
lim <- c (min (x[1:2]), max (x[1:2]))
52

53
###########################################
54

55
png (file = plot_name, width=800, height=700, res=80)
56

57
par (mfrow = c(2,2))
58

59
boxplot (bytestat (x,1), main = titleOld, ylab="Ticks",
60
         col = red, ylim = lim, names = xlabels, sub = note1)
61
    abline (h=mean(x$Old), lty=3)
62

63
boxplot (bytestat (x,2), main = titleNew, ylab="Ticks",
64
         col = green, ylim = lim, names = xlabels, sub = note2)
65
    abline (h=mean(x$New), lty=3)
66

67
boxplot (bytestat (x,6), main="Speed Gain in Ticks", ylab="Gained Ticks",
68
         col = blue, names = xlabels)
69
    abline (h=mean(x$Gain), lty=3)
70

71
boxplot (bytestat (x,7), main="Speed Gain in %", ylab="Gained %",
72
         col = blue2, names = xlabels)
73
    abline (h=-gmean(-x$"Gain %"), lty=3)
74

75
dev.off()
Angehängte Dateien:
Persönliche Seite #2721678
Lesenswert?

Ahhh, ja. Damit geht's.

...und die Frames noch ein bisschen rumschubsen:
1
par (mfrow = c(2,2), oma=c(0, 0, 5, 0), mar=c(3.1, 3.1, 2.1, 1.1))
2
boxplot (...)
3
title (main=titleAll, line=3, outer=TRUE)

> *Background*
>
> R is such a graphics-rich analysis language, yet ironically the
> description of many of its graphics features are not explained
> visually.  R's graphical parameters are a bit overwhelming and the
> alphabetical order of the dozens and dozens of parameters — there
> are more than 70 — in the online documentation doesn't help beginners
> discern groups and relationships among these parameters very easily.

http://research.stowers-institute.org/efg/R/Graphics/Basics/mar-oma/index.htm

Dankeschön :-)

Antwort schreiben

Bitte melde dich an, um einen Beitrag zu schreiben.

oder

Mit Google-Account einloggen

Die Registrierung ist kostenlos und dauert nur eine Minute.

Jetzt registrieren