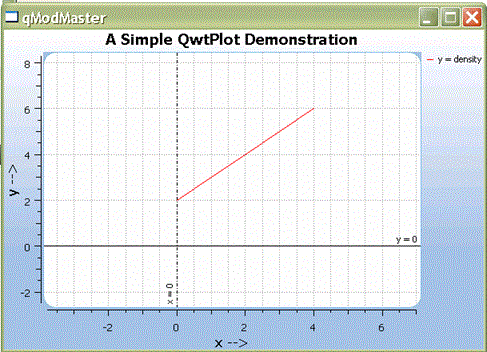
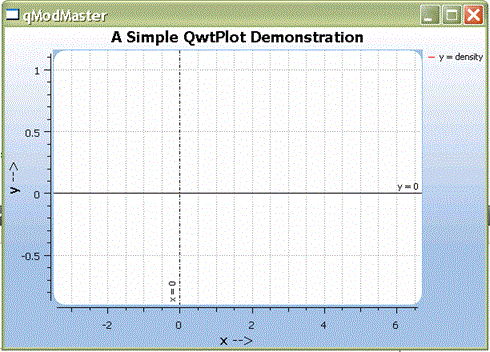
Qt & qwtPlot --> keine plots bei Aufruf der Fkt. ausserhalb des plot Moduls

#3135843
Lesenswert?

Hallo Leute

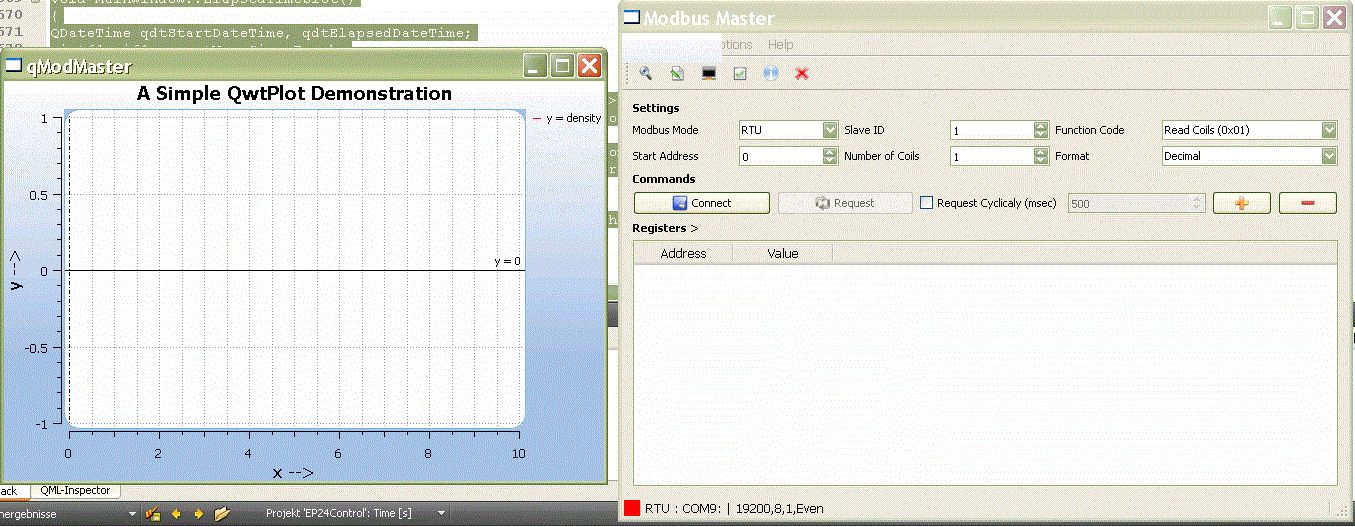
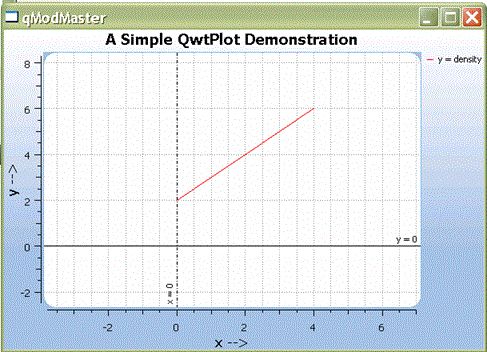
Ich versuche vorerst einige Testkurven in Qt4 mit der Library qwtplot 
anzuzeigen. Beim Aufruf der Funktion populate() im Konstruktor 
Plot::Plot..., werden die Testkurven angezeigt.
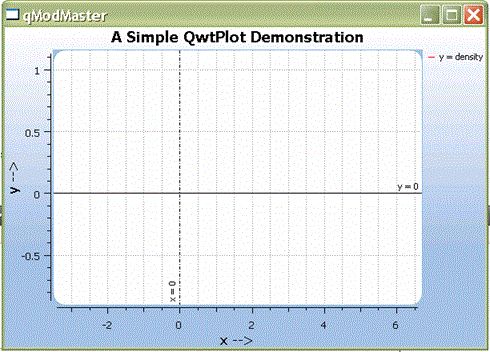
Wenn ich aber die Fkt. populate() im module modbusadapter.cpp (nach 
einer modbus response) aufrufe, dann wird leider nichts geplottet. Im 
Debug Mode kann ich sehen, dass der Spung in populate() stattfindet, 
wird aber eben nichts angezeigt.

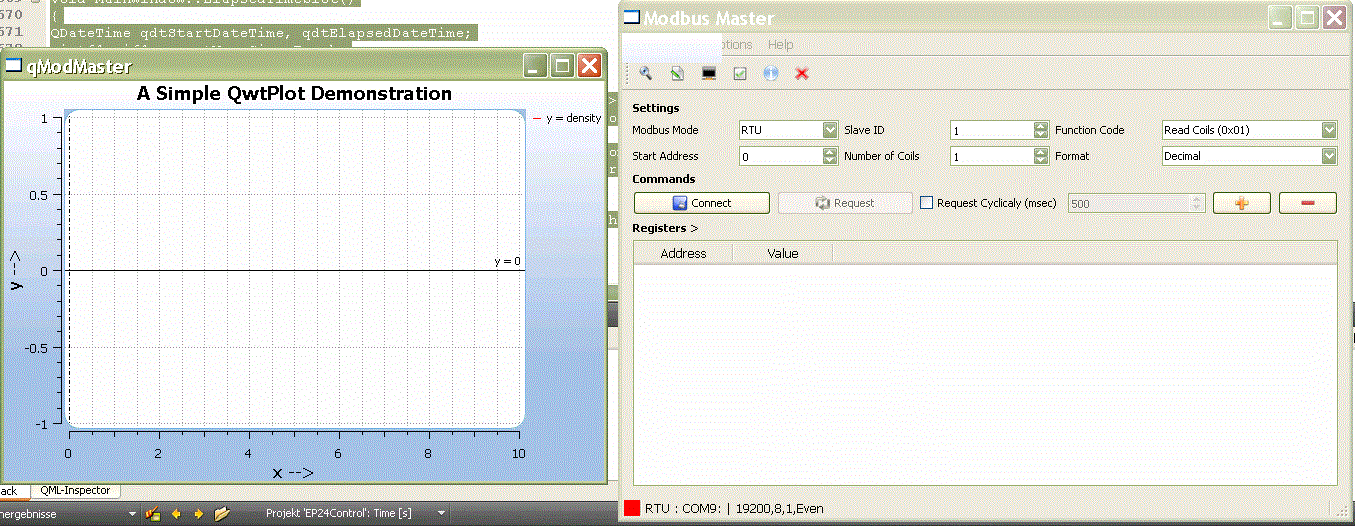
Ich verwende zwei separate Fenster, einer für die Modbus Kommunikation 
und das andere Fenster für die Plots. Ich hoffe nicht, dass diese zwei 
"Instanzen" das Problem ist.

Hier einige Code Ausschnitte:

plot.h
1
#ifndef PLOT_H
2
#define PLOT_H
3

4
#include <qapplication.h>
5
#include <qlayout.h>
6
#include <qwt_plot.h>
7
#include <qwt_plot_grid.h>
8
#include <qwt_plot_marker.h>
9
#include <qwt_plot_curve.h>
10
#include <qwt_legend.h>
11
#include <qwt_series_data.h>
12
#include <qwt_plot_canvas.h>
13
#include <qwt_plot_panner.h>
14
#include <qwt_plot_magnifier.h>
15
#include <qwt_text.h>
16
#include <qwt_math.h>
17
#include <math.h>
18

19
#define SIZE 15
20

21
class Plot : public QwtPlot
22
{
23
    Q_OBJECT
24

25
public:
26
    Plot(QWidget * = NULL);
27
    virtual ~Plot();
28
    void setPlotValue(double value);
29
    void populate();
30

31
protected:
32
    virtual void resizeEvent( QResizeEvent * );
33

34
private:
35
    void updateGradient();
36
    double cntX;
37
    QwtPlotCurve *density;
38
    double xData[SIZE];
39
    double yData[SIZE];
40

41
public slots:
42
    void addNewValue(double value);
43

44
signals:
45

46
};
47
#endif // PLOT_H


plot.cpp
1
#include "plot.h"
2

3
Plot::Plot(QWidget *parent):
4
    QwtPlot( parent )
5
{
6
    xData[0] = 0;
7
    yData[0] = 0;
8

9
    // Insert new density curve
10
    density = new QwtPlotCurve("y = density");
11
    //density->setRenderHint(QwtPlotItem::RenderAntialiased);
12
    density->setStyle(QwtPlotCurve::Lines);
13
    density->setLegendAttribute(QwtPlotCurve::LegendShowLine, true);
14
    density->setPen(QPen(Qt::red));
15
    density->attach(this);
16

17
    // Draw grid
18
    QwtPlotGrid *grid = new QwtPlotGrid();
19
    grid->setPen(QPen(Qt::gray, 0.0, Qt::DotLine));
20
    grid->enableX(true);
21
    grid->enableXMin(true);
22
    grid->enableY(true);
23
    grid->enableYMin(false);
24
    grid->attach(this);
25

26
    // Insert markers
27
    //  ...a horizontal line at y = 0...
28
    QwtPlotMarker *mY = new QwtPlotMarker();
29
    mY->setLabel(QString::fromLatin1("y = 0"));
30
    mY->setLabelAlignment(Qt::AlignRight|Qt::AlignTop);
31
    mY->setLineStyle(QwtPlotMarker::HLine);
32
    mY->setYValue(0.0);
33
    mY->attach(this);
34

35
    //  ...a vertical line at x = 0...
36
    QwtPlotMarker *mX = new QwtPlotMarker();
37
    mX->setLabel(QString::fromLatin1("x = 0"));
38
    mX->setLabelAlignment(Qt::AlignLeft | Qt::AlignBottom);
39
    mX->setLabelOrientation(Qt::Vertical);
40
    mX->setLineStyle(QwtPlotMarker::VLine);
41
    mX->setLinePen(QPen(Qt::black, 0, Qt::DashDotLine));
42
    mX->setXValue(0.0);
43
    mX->attach(this);
44

45
    // panning with the left mouse button
46
    (void) new QwtPlotPanner( canvas() );
47

48
    // zoom in/out with the wheel
49
    (void) new QwtPlotMagnifier( canvas() );
50

51
    setAutoFillBackground( true );
52
    setPalette( QPalette( QColor( 165, 193, 228 ) ) );
53
    updateGradient();
54

55
    setTitle("A Simple QwtPlot Demonstration");
56
    insertLegend(new QwtLegend(), QwtPlot::RightLegend);
57

58
    // axes
59
    setAxisTitle(xBottom, "x -->" );
60
    setAxisScale(xBottom, 0.0, 10.0);
61

62
    setAxisTitle(yLeft, "y -->");
63
    setAxisScale(yLeft, -1.0, 1.0);
64

65
    // canvas
66
    canvas()->setLineWidth( 1 );
67
    canvas()->setFrameStyle( QFrame::Box | QFrame::Plain );
68
    canvas()->setBorderRadius( 15 );
69

70
    QPalette canvasPalette( Qt::white );
71
    canvasPalette.setColor( QPalette::Foreground, QColor( 133, 190, 232 ) );
72
    canvas()->setPalette( canvasPalette );
73

74
    //populate();         // beim Aufruf von hier aus, funktionieren die Plots...
75
}
76

77
Plot::~Plot()
78
{
79

80
}
81

82
void Plot::populate()
83
{
84
    qWarning()<<  "Plot : populate()";
85

86
    double maxD = 0;
87
    double minD = 1;
88
    double maxS = 0;
89
    double minS = 1;
90

91
    double dens = 2.0;
92
    unsigned int sample = 0;
93
    unsigned int x = 0;
94
    unsigned int y = 0;
95

96
    while(sample < 5)
97
    {
98
        xData[x++]= sample;
99
        yData[y++]= dens;
100

101
        maxS = sample;
102
        minS = sample++;
103
        maxD = dens;
104
        minD = dens++;
105

106
        setAxisScale(xBottom, (int)minS-1, (int)maxS+1);
107
        setAxisScale(yLeft,   (int)minD-1, (int)maxD+1);
108

109
        density->setSamples(xData, yData, sample);
110
    }
111
    setAutoReplot(true);
112
    // Call "replot()" to refresh plot displaying
113
    replot();
114
}
#3135846
Lesenswert?

hier noch den Rest:

main
1
#include <QtGui/QApplication>
2
#include "mainwindow.h"
3
#include "plot.h"
4

5
int main(int argc, char *argv[])
6
{
7
    QApplication a(argc, argv);
8

9
    Plot *plot = new Plot();
10

11
    // We put a dummy widget around to have
12
    // so that Qt paints a widget background
13
    // when resizing
14

15
    QWidget window;
16
    QHBoxLayout *layout = new QHBoxLayout( &window );
17
    layout->setContentsMargins( 0, 0, 0, 0 );
18
    layout->addWidget( plot );
19

20
    window.resize(600,400);
21
    window.show();
22

23
    MainWindow w;
24
    w.show();
25

26
    return a.exec();
27
}


modbusadapter.h
1
#ifndef MODBUSADAPTER_H
2
#define MODBUSADAPTER_H
3

4
#include <QObject>
5
#include "modbus.h"
6
#include "registersmodel.h"
7
#include "rawdatamodel.h"
8
#include <QTimer>
9
#include "eutils.h"
10

11
#include "plot.h"
12

13
class ModbusAdapter : public QWidget
14
{
15
    Q_OBJECT
16

17
public:
18
    explicit ModbusAdapter(QWidget *parent = 0);
19

20
     void busMonitorRequestData(uint8_t * data,uint8_t dataLen);
21
     void busMonitorResponseData(uint8_t * data,uint8_t dataLen);
22

23
     void modbusConnectRTU(QString port, int baud, QChar parity, int dataBits, int stopBits);
24
     void modbusConnectTCP(QString ip, int port);
25
     void modbusDisConnect();
26
     void modbusRequestData(int slave, int functionCode, int startAddress, int noOfItems);
27
     RegistersModel *regModel;
28
     RawDataModel *rawModel;
29
     Plot *plotNewDensity;
30
     bool isConnected();
31

32
private:
33
     modbus_t * m_modbus;
34
     bool m_connected;
35
     bool m_RTUSelected;
36

37
signals:
38
     void newDensityValue(double value);
39

40
public slots:
41

42
};
43

44
#endif // MODBUSADAPTER_H


modbusadapter.cpp
1
#include "modbusadapter.h"
2
#include <QMessageBox>
3
#include <QtDebug>
4
#include <errno.h>
5

6
ModbusAdapter *m_instance;
7
static const int DBG = false; //Debug messages from libmodbus
8

9
ModbusAdapter::ModbusAdapter(QWidget *parent) :
10
    QWidget(parent),
11
    m_modbus(NULL)
12
{
13
    m_instance=this;
14
    regModel=new RegistersModel(this);
15
    rawModel=new RawDataModel(this);
16

17
    plotNewDensity=new Plot(this);
18

19
    m_connected = false;
20
}
21

22
...
23
...
24
...
25
            case _FC_READ_INPUT_REGISTERS:
26
                    ret = modbus_read_input_registers(m_modbus, startAddress, noOfItems, dest16);
27
                    is16Bit = true;
28
                    break;
29
...
30
...
31
...
32
            // nach modbus response...
33
            plotNewDensity->populate();
34
...
35
...
36
...
37
            }


Bin froh um jeden Tipp.

Danke und Gruss

Antwort schreiben

Bitte melde dich an, um einen Beitrag zu schreiben.

oder

Mit Google-Account einloggen

Die Registrierung ist kostenlos und dauert nur eine Minute.

Jetzt registrieren