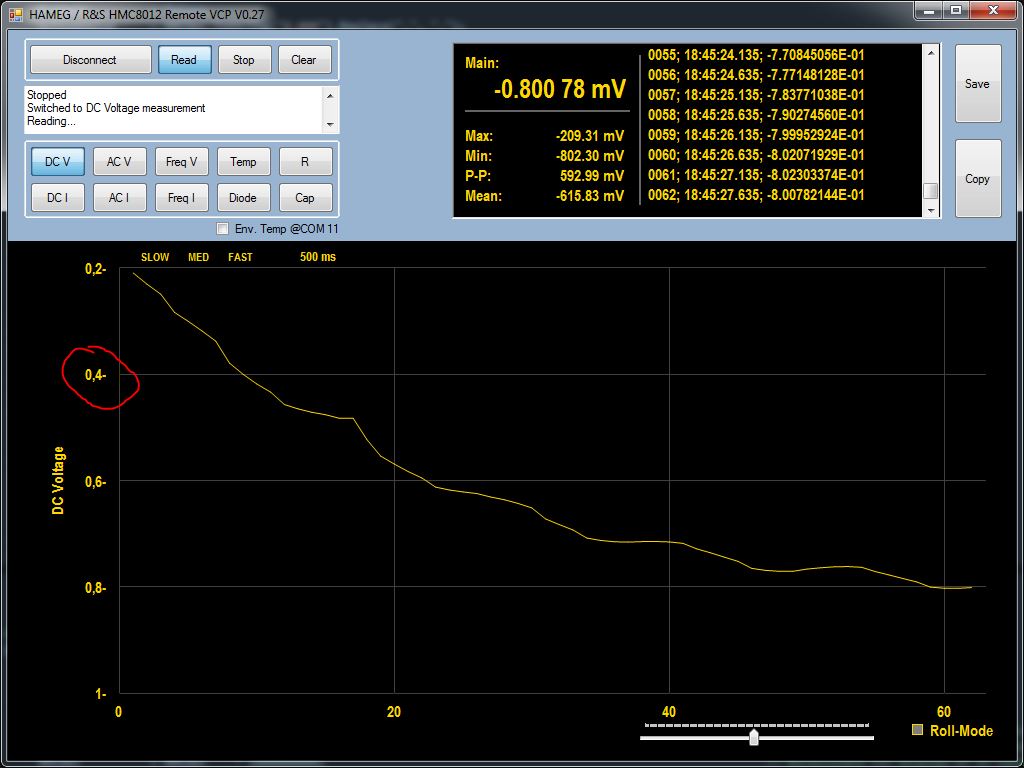
1 | //
|
2 | // chart1
|
3 | //
|
4 | this.chart1.BackColor = System.Drawing.Color.Black;
|
5 | this.chart1.BorderlineColor = System.Drawing.Color.DimGray;
|
6 | this.chart1.BorderlineWidth = 2;
|
7 | chartArea1.AxisX.IsLabelAutoFit = false;
|
8 | chartArea1.AxisX.LabelStyle.Font = new System.Drawing.Font("Arial Narrow", 12F, System.Drawing.FontStyle.Bold, System.Drawing.GraphicsUnit.Point, ((byte)(0)));
|
9 | chartArea1.AxisX.LabelStyle.ForeColor = System.Drawing.Color.Gold;
|
10 | chartArea1.AxisX.LineColor = System.Drawing.Color.Gray;
|
11 | chartArea1.AxisX.LineDashStyle = System.Windows.Forms.DataVisualization.Charting.ChartDashStyle.NotSet;
|
12 | chartArea1.AxisX.MajorGrid.LineColor = System.Drawing.Color.FromArgb(((int)(((byte)(64)))), ((int)(((byte)(64)))), ((int)(((byte)(64)))));
|
13 | chartArea1.AxisY.IsLabelAutoFit = false;
|
14 | chartArea1.AxisY.LabelAutoFitStyle = ((System.Windows.Forms.DataVisualization.Charting.LabelAutoFitStyles)((((System.Windows.Forms.DataVisualization.Charting.LabelAutoFitStyles.IncreaseFont | System.Windows.Forms.DataVisualization.Charting.LabelAutoFitStyles.DecreaseFont)
|
15 | | System.Windows.Forms.DataVisualization.Charting.LabelAutoFitStyles.StaggeredLabels)
|
16 | | System.Windows.Forms.DataVisualization.Charting.LabelAutoFitStyles.LabelsAngleStep30)));
|
17 | chartArea1.AxisY.LabelStyle.Font = new System.Drawing.Font("Arial Narrow", 12F, System.Drawing.FontStyle.Bold, System.Drawing.GraphicsUnit.Point, ((byte)(0)));
|
18 | chartArea1.AxisY.LabelStyle.ForeColor = System.Drawing.Color.Gold;
|
19 | chartArea1.AxisY.LabelStyle.Interval = 0D;
|
20 | chartArea1.AxisY.LabelStyle.IntervalType = System.Windows.Forms.DataVisualization.Charting.DateTimeIntervalType.Number;
|
21 | chartArea1.AxisY.LineColor = System.Drawing.Color.FromArgb(((int)(((byte)(64)))), ((int)(((byte)(64)))), ((int)(((byte)(64)))));
|
22 | chartArea1.AxisY.MajorGrid.LineColor = System.Drawing.Color.FromArgb(((int)(((byte)(64)))), ((int)(((byte)(64)))), ((int)(((byte)(64)))));
|
23 | chartArea1.AxisY.TitleFont = new System.Drawing.Font("Arial Narrow", 12F, System.Drawing.FontStyle.Bold, System.Drawing.GraphicsUnit.Point, ((byte)(0)));
|
24 | chartArea1.BackColor = System.Drawing.Color.Black;
|
25 | chartArea1.CursorX.SelectionColor = System.Drawing.Color.Gold;
|
26 | chartArea1.CursorY.Interval = 1E-12D;
|
27 | chartArea1.CursorY.SelectionColor = System.Drawing.Color.Gold;
|
28 | chartArea1.Name = "ChartArea1";
|
29 | this.chart1.ChartAreas.Add(chartArea1);
|
30 | this.chart1.Cursor = System.Windows.Forms.Cursors.Cross;
|
31 | this.chart1.Dock = System.Windows.Forms.DockStyle.Bottom;
|
32 | legend1.Alignment = System.Drawing.StringAlignment.Center;
|
33 | legend1.Docking = System.Windows.Forms.DataVisualization.Charting.Docking.Bottom;
|
34 | legend1.Name = "Legend1";
|
35 | this.chart1.Legends.Add(legend1);
|
36 | this.chart1.Location = new System.Drawing.Point(0, 211);
|
37 | this.chart1.Margin = new System.Windows.Forms.Padding(2);
|
38 | this.chart1.Name = "chart1";
|
39 | this.chart1.RightToLeft = System.Windows.Forms.RightToLeft.Yes;
|
40 | series1.ChartArea = "ChartArea1";
|
41 | series1.ChartType = System.Windows.Forms.DataVisualization.Charting.SeriesChartType.Line;
|
42 | series1.Color = System.Drawing.Color.Gold;
|
43 | series1.Font = new System.Drawing.Font("Arial Narrow", 13F, System.Drawing.FontStyle.Bold);
|
44 | series1.IsVisibleInLegend = false;
|
45 | series1.LabelBackColor = System.Drawing.Color.Transparent;
|
46 | series1.LabelBorderColor = System.Drawing.Color.White;
|
47 | series1.LabelForeColor = System.Drawing.Color.Gold;
|
48 | series1.Legend = "Legend1";
|
49 | series1.Name = "DC Voltage";
|
50 | this.chart1.Series.Add(series1);
|
51 | this.chart1.Size = new System.Drawing.Size(1008, 519);
|
52 | this.chart1.TabIndex = 5;
|
53 | this.chart1.Text = "chart1";
|
54 | this.chart1.MouseClick += new System.Windows.Forms.MouseEventHandler(this.chart1_MouseClick);
|
55 | this.chart1.MouseMove += new System.Windows.Forms.MouseEventHandler(this.chart1_MouseMove);
|
56 | //
|

 Chart.JPG
(100 KB)
Chart.JPG
(100 KB)