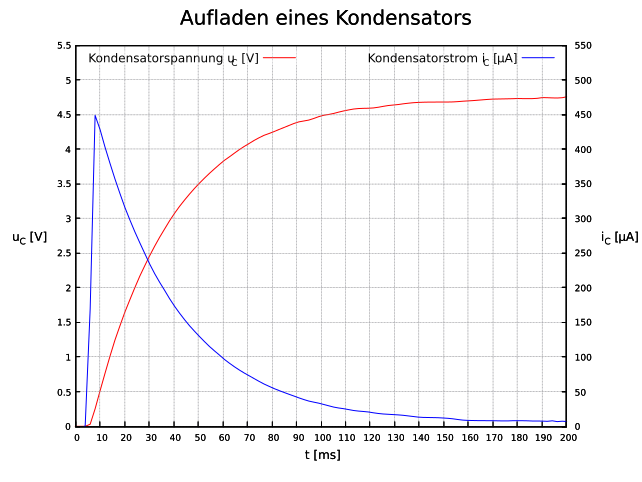
Hi Leute,

ich habe momentan ein Problem beim plotten. Und zwar möchte mir GNUplot
perse nicht die Funktion y(x) und z mit in den Graphen plotten, nur
leider überschreitet das meine bisherigen Kenntnisse. Wenn ich die
beiden Funktionen separat plotte, funktioniert alles einwandfrei.

Hier mein Skript:

reset

u = 5
r = 10E3
c = 3.3E-6
t = 0.7E-3

set encoding utf8
set grid
set title "Aufladen eines Kondensators" font ",20"
set xlabel 't [ms]' font ",12"
set ylabel 'u_{C} [V]' offset char -3 rotate by 0 font ",12"
set y2label 'i_{C} [{/symbol m}A]' offset char 3 rotate by 0 font ",12"
set xrange    [0:200]
set yrange    [0:u+0.5]
set y2range    [0:((u+0.5)/r*1E6)]
set xtics 10 nomirror
set ytics 0.5
set y2tics 50
set lmargin 15
set bmargin 5
set rmargin 15

set dummy x

y(x) = (u/(r*c)*exp(-t/(r*c))*(x-t*1E3)+u*(1-exp(-t/(r*c))))/1000

z = 4.75

set multiplot

set key left top font ",12"
plot 'Aufladen.txt' using ($1+10.08925134):($2*(-1)) axes x1y1 smooth
sbezier title "Kondensatorspannung u_{C} [V]" with lines lc rgb "red"

set key right top font ",12"
plot 'Aufladen.txt' using ($1+10.08925134):($3/r*1E6) axes x1y2 smooth
sbezier title "Kondensatorstrom i_{C} [{/symbol m}A]" with lines lc rgb
"blue"

plot y(x) axes x1y1 notitle with lines lc rgb "black"

plot z axes x1y1 notitle with lines lc rgb "black"

unset multiplot
Angehängte Dateien:
-
 Aufladen.svg
(340 KB)
-
 aufladen.png
(34 KB)