Hallo ,
ich habe ein Problem mit der zeitlichen Darstellung von Temperaturen in
Gnuplot.
Ich habe folgenden Datensatz:
00:00:41 57.1 30.3 13.1 65.1 3.3 0.00
00:00:53 57.1 30.3 13.1 65.1 3.3 0.00
00:01:06 57.1 30.3 13.1 65.1 3.3 0.00
alle 12 Sekunden wird ein Datensatz geschrieben.
Also werden an einem Tag 7200 Datensätze gesammelt.
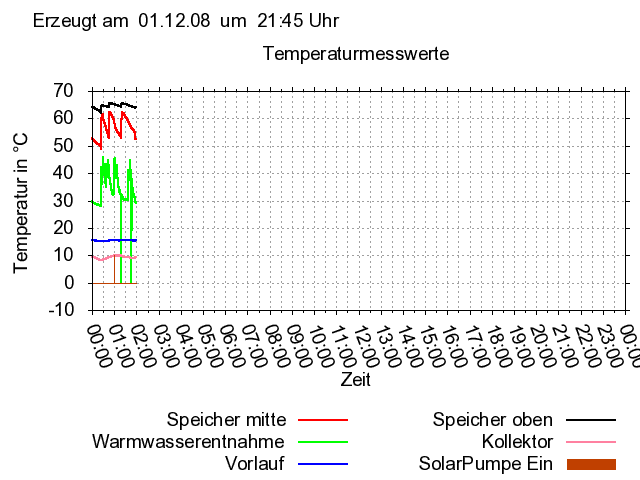
Wenn ich die Daten mit Gnuplot ausgeben lasse ,erhalte ich nur für 2
Stunden eine Ausgabe.
Hat jemand eine Idee wie ich die 7200Datensätze auf 24Stunden verteilt
bekomme.
Hier die Gnuplot-Steuerdatei:
set key below
set timestamp "Erzeugt am %d.%m.%y um %H:%M Uhr" top
set grid xtics ytics mxtics mytics
set title "Temperaturmesswerte"
set xdata time
set timefmt "%H:%M:%S"
set format x "%H:%M"
set ytics mirror
set xrange ["00:00":"24:00"]
set xtics 3600 rotate by -70
set tics out
set xlabel "Zeit"
set ylabel "Temperatur in °C"
set terminal gif large font arial size 1024,768
set output "grafik08mitzeit.gif"
plot [0:86400] "heizung.txt" using 0:2 title "Speicher mitte" with lines
lt rgb "#ff0000" lw 2, "heizung.txt" using 0:3 title
"Warmwasserentnahme" with lines lt rgb "#00ff00" lw 2, "heizung.txt"
using 0:4 title "Vorlauf" with lines lt rgb "#0000ff" lw 2,
"heizung.txt" using 0:5 title "Speicher oben" with lines lt rgb
"#000000" lw 2, "heizung.txt" using 0:6 title "Kollektor" with lines lt
rgb "#FF69B4" lw 2 , "heizung.txt" using 0:7 title "SolarPumpe Ein" with
boxes fs solid 1
Wenn jemand eine Lösung weiss ,bitte antworten.
Gruß
Frank
Angehängte Dateien:
-

grafik08mitzeit.png
8,4 KB
In der plot-Anweisung muss statt 0:2, 0:3 usw. 1:2, 1:3 usw. stehen.
Sonst wird als x-Wert nicht die Zeit, sondern eine fortlaufende Nummer
(0 bis 7199) genommen, was einem Zeitintervall von 0 bis etwa 2h
entspricht.
Hallo Homie,

ich plotte meine Messdaten immer wiefolgt:

#================================================================
#            GNUPLOT
#---------------------------------------------------------------
set terminal pbm color smal   size 1000,750
#et term postscript color
#set term X11
#---------------------------------------------------------------
# 00_Emic644:
# 13:58:57 2008-01-01  2184 3618
# 14:04:59 2008-01-01  2172 3673
# 14:07:59 2008-01-01  2096 3783
#    1        2         3    4
#     Format
#      %d           day of the month, 1--31
#      %m           month of the year, 1--12
#      %y           year, 0--99
#      %Y           year, 4-digit
#      %j           day of the year, 1--365
#      %H           hour, 0--24
#      %M           minute, 0--60
#      %s           seconds since the Unix epoch (1970-01-01, 00:00 UTC)
#      %S           second, 0--60
#      %b           three-character abbreviation of the name of the
month
#      %B           name of the month

set title " Temp. / Humidity "
set xlabel " time "
set ylabel " °C x100 / % x100 "
set grid

set xdata time
set timefmt "%H:%M:%S %Y-%m-%d"
set format x "%y-%m\nD %d\nh %H"

plot "00_Emic644" using 1:3 smooth bezier, "00_Emic644" using 1:4 smooth
bezier
#=======================================================================
==

Gruss
   horst.
Hallo yalu,hallo Horst

ich danke Euch für den Tip !!!!
Es funktioniert !!


Gruß
     Frank
Bitte melde dich an um einen Beitrag zu schreiben. Anmeldung ist kostenlos und dauert nur eine Minute.
Bestehender Account
Schon ein Account bei Google/GoogleMail? Keine Anmeldung erforderlich!
Mit Google-Account einloggen
Mit Google-Account einloggen
Noch kein Account? Hier anmelden.