
Hallo,

Ich nehme eine periodische Zeitsignal von LT_Spice als Text-File und
möchte ich mit Matlab extern die Interpolation und FFT mache, um die
Ergebnisse zu vergleichen.
Die Hilfe von Matlab über FFT und vq = interp1(x,v,xq) habe ich gelesen
und habe ich versucht in Matlab FFT mache, leider konnte ich nicht zu
Recht kommen.

Kann jemand mir bitte sagen, wie ich aus Text-File von Lt_spice in
Matlab FFT machen kann?

Für Hilfe wäre ich sehr dankbar.

Viele Grüße
Gast
#5669283
Erst mal die Ausgabe von LTSpice prüfen. Dazu versuche die Datei in
Office einzulesen und als csv abzuspeichern. Wenn dabei vernünftige
Zahlenreihen vorliegen, erst dann macht es Sinn sich mit Matlab zu
befassen.
Gast
#5669292
Hallo Roboto-Klon
vielen Dank für die Antwort.
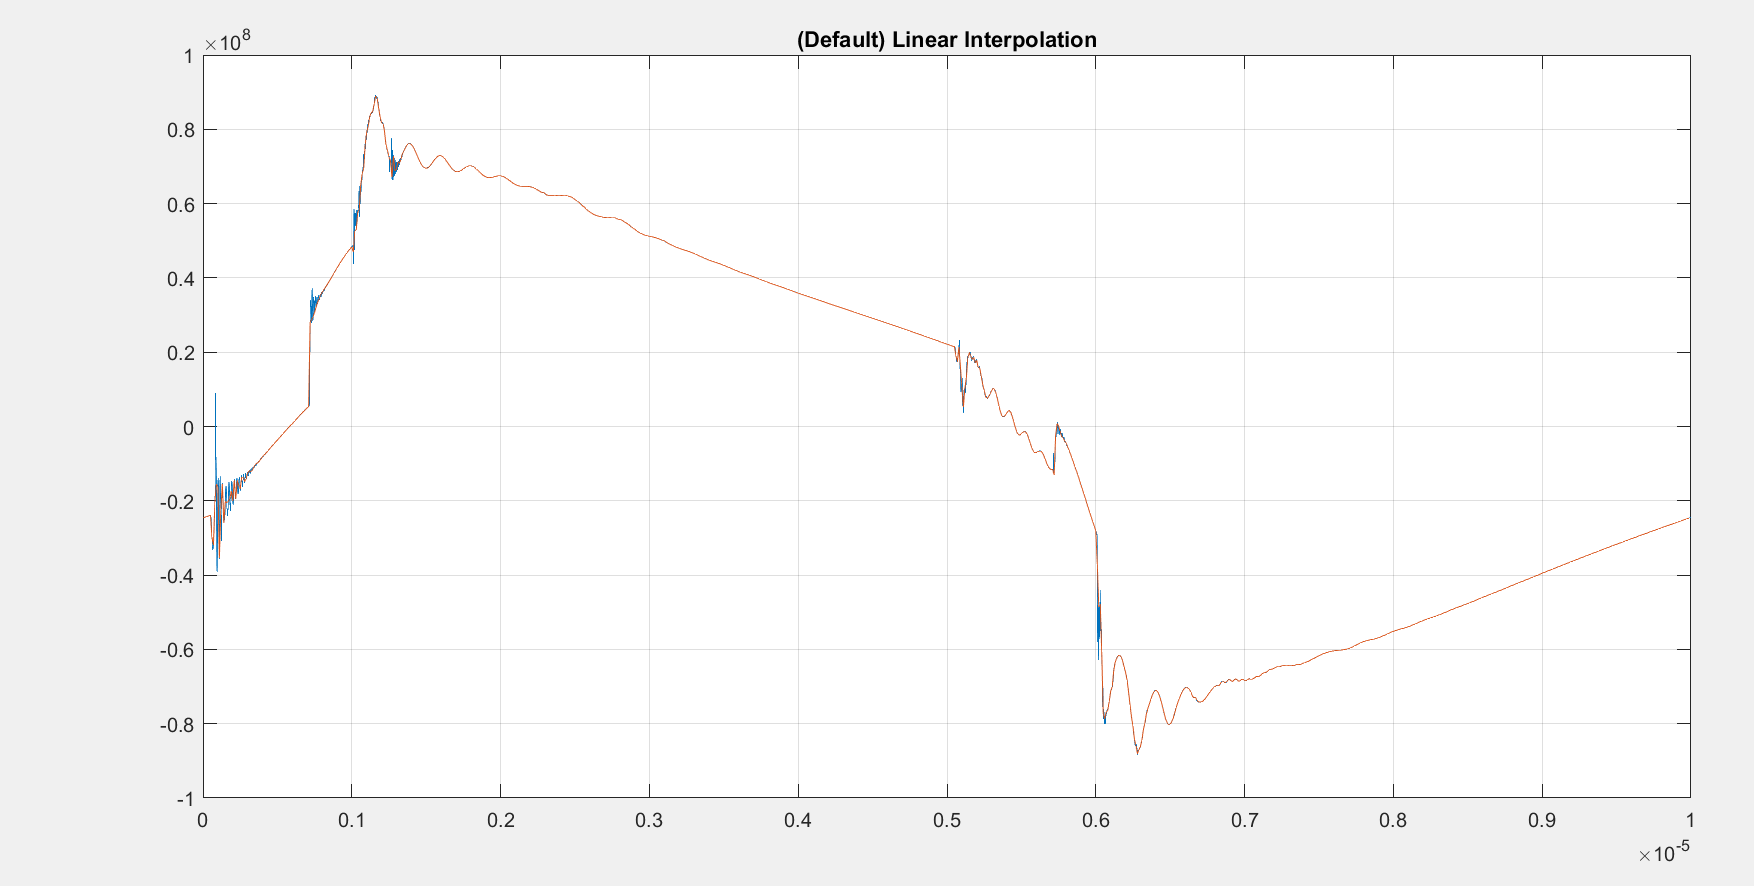
die Text-Datei kann in Matlab gepoltet werden und ich habe mit Funktion
vq1 = interp1(x,v,xq) das Signal interpoltiert und möchte ich von diesem
interpoltierten Signal FFT machen Signal.

Im Anhang befindet sich das geplotete Signal.


Gruß
Angehängte Dateien:
-
 Unbenannt.PNG
(22 KB)
Unbenannt.PNG
(22 KB)
hm,

20*log10(abs(fft(interp1(x,v,xq))))? ganz sicher bin ich mir nicht
Gast
#5669443
Vermutlich wirst Du die Datei erst in eine Matrix einlesen müssen. Und
diese Matrix kann einer Fouriertransformation unterzogen werden.
Hallo Keiner N.
vielen Dank für die Antwort.
es hat nicht funktioniert.
Gruß
ich möchte von interpolierte Signal fft machen.

Gruß
Gast
#5669501
Noch ein paar Info-Schnipsel:

https://www.gomatlab.de/txt-als-matrix-einlesen-t21116.html

https://de.mathworks.com/help/matlab/ref/fft.html

Auf ein gutes Gelingen des Experimentierens mit MatLab FFT.
Hallo Dieter,

mit Import von Text-Datei habe ich kein Problem nur möchte von von
interpolierte Signal fft machen und schauen wie die Störspannung aus
EMV-Gesichtpunkt aussieht.


Gruß
Hier ein Beispiel

% FFT with Matlab
fileid = fopen("test_t.txt",'r'); % open file for read
% h_text = textscan(fileid,'%s',2) % read the two word header from
LTspice-exported file
[a n]=fscanf(fileid,"%e");      % a data, n size of a
fclose(fileid);
x = a(1:2:n-1);                 % x-values
y = a(2:2:n);                   % y values
n_fft = 16384;                  % size for the FFT
tmax = 10e-6;                   % time 0 to tmax
t = linspace(0,tmax,n_fft+1);   % time vector 0 to 10us
z = interp1(x,y,t(1:n_fft));    % interpolate y-values
zfft = fft(z,n_fft)/(n_fft/2);  % FFT
zfftabs = abs(zfft(1:(n_fft/2))); % absolute values
zfftabs(1) = zfftabs(1)/2;      %  value at DC-value, f=0Hz
f0 = 1/tmax;                    % base frequency
f = f0*linspace(0,n_fft/2-1,n_fft/2);  % frequency vector, f = 0 to
f0*(n_fft/2-1)
zfftabsdB = 20*log10(zfftabs);  % absolute values in dB
% plot(f,zfftabs)
% plot(f(1:10),zfftabsdB(1:10),'*') % '+' '-' '.'
% line(f(1:10),zfftabsdB(1:10))     '
Hallo Helmut,

vielen herzlichen Dank!

Viele Grüße
Antwort schreiben
Bitte melde dich an, um einen Beitrag zu schreiben.