Hallo,
habe ein Olimex STM32-P107 Board mit ST-Link V2 und versuche gerade eine
Eclipse Entwicklungsumgebung einzurichten. Davor habe ich mit Atollic
TrueStudio programmiert, da es aber eine 32kB Code Size Limitation hat,
ist es für mich uninteressant geworden.

Nach zahlreichen Anleitungen habe ich es geschafft, mit
-  Eclipse Juno (C/C++ Developer),
-  den Files von Atollic  für Board / Prozessor sowie dem GDB Server
-  und der Codesourcery Toolchain (ARM EABI)

ein Beispielprojekt fehlerfrei zu builden. Beim Builden wird ein .bin
File erstellt, welches ich mittels ST-Link Utility auf das Board laden
kann. Die Funktion, hier in meinem Fall als Test, LED blinken, wird
erfüllt.

Soweit sogut. Das einzige was mir noch Kopfschmerzen bereitet ist das
Debugging. Seit zwei Tagen versuche ich schon ohne Erfolg, das Debugging
zum Laufen zu bekommen.
Unter External Tools habe ich den gdb-Server von Atollic drin (v1.6),
welcher auch mit TrueStudio funktioniert, in den Arguments habe ich -c
"config.txt".
Unter Debugging habe ich einen neuen Eintrag bei Hardware-Debugging
erstellt mit den Parametern

--Main--
C/C++ Application: [test].elf
Project: test
Build-Configuration: Debug
Disable Auto Build
--Debugger--
GDB Setup:
CodeSourcery\Sourcery_CodeBench_Lite_for_ARM_EABI\bin\arm-none-eabi-gdb.
exe
Häkchen bei Use Remote Target
JTAG Device: Generic TCP/IP
Host: localhost
Port: 61234
--Startup--
Reset and Delay: 3
Halt
Load Image: test.elf
Load Symbols: test.elf
Set breakpoint at: main
--Source--
Source Lookup Path: Default
--Common--
Save as: Local file
Encoding: Default – inherited(Cp1252)
Standard Input and Output: Allocate console

Ausserdem noch: Using GDB (DSF) Hardware Debugging Launcher


Beim Ausführen des External Tool wird an der Konsole ausgegeben:
---
Atollic TrueSTUDIO gdbserver for ST-Link.  Version 1.6.0  Pro
Copyright 2010-2012, Atollic AB.

Starting server with the following options:
        Persistant Mode            : Enabled
        LogFile Name               : debug.log
        Logging Level              : 1
        Listen Port Number         : 61234
        Status Refresh Delay       : 32s
        Verbose Mode               : Disabled
        SWD Debug                  : Enabled

Connecting to the ST-Link Debugger... OK
Waiting for debugger connection...
---

Dabei leuchtet die LED des ST-Link V2 grün.
Wenn ich dann meinen Debugger ausführe, kommt folgende Fehlermeldung:
---
Error in final launch sequence
Failed to execute MI command:
-target-select remote localhost:61234

Error message from debugger back end:
Remote connection closed
Remote connection closed
---

Ausgabe der Konsole nach ausführen von External Tools und Debugging:
---
Atollic TrueSTUDIO gdbserver for ST-Link.  Version 1.6.0  Pro
Copyright 2010-2012, Atollic AB.


Starting server with the following options:
        Persistant Mode            : Enabled
        LogFile Name               : debug.log
        Logging Level              : 1
        Listen Port Number         : 61234
        Status Refresh Delay       : 32s
        Verbose Mode               : Disabled
        SWD Debug                  : Enabled

Connecting to the ST-Link Debugger... OK
Waiting for debugger connection...Error while waiting for debugger
connection.
Shutting down...
Debugger connection lost.
Shutting down...
---

Weis jemand Rat, wie ich das Debugging zum Laufen bekomme? Danke.
Firedog schrieb:
> Failed to execute MI command:
> -target-select remote

Hier liegt das Problem.

Probier mal:
1 | * Start gdb from the command line using the MI flag so that GDB accepts the commands as sent from Eclipse : |
2 | gdb -i mi |
wie hier beschrieben:

http://wiki.eclipse.org/CDT/User/FAQ#What_should_I_do_when_the_debugging_session_misbehaves.3F
https://sites.google.com/site/stm32discovery/open-source-development-with-the-stm32-discovery/getting-hardware-debuging-working-with-eclipse-and-code-sourcey
hilft vielleicht weiter, mir hat es das jedenfalls.
Angehängte Dateien:
-

stm32gdb.png
37 KB
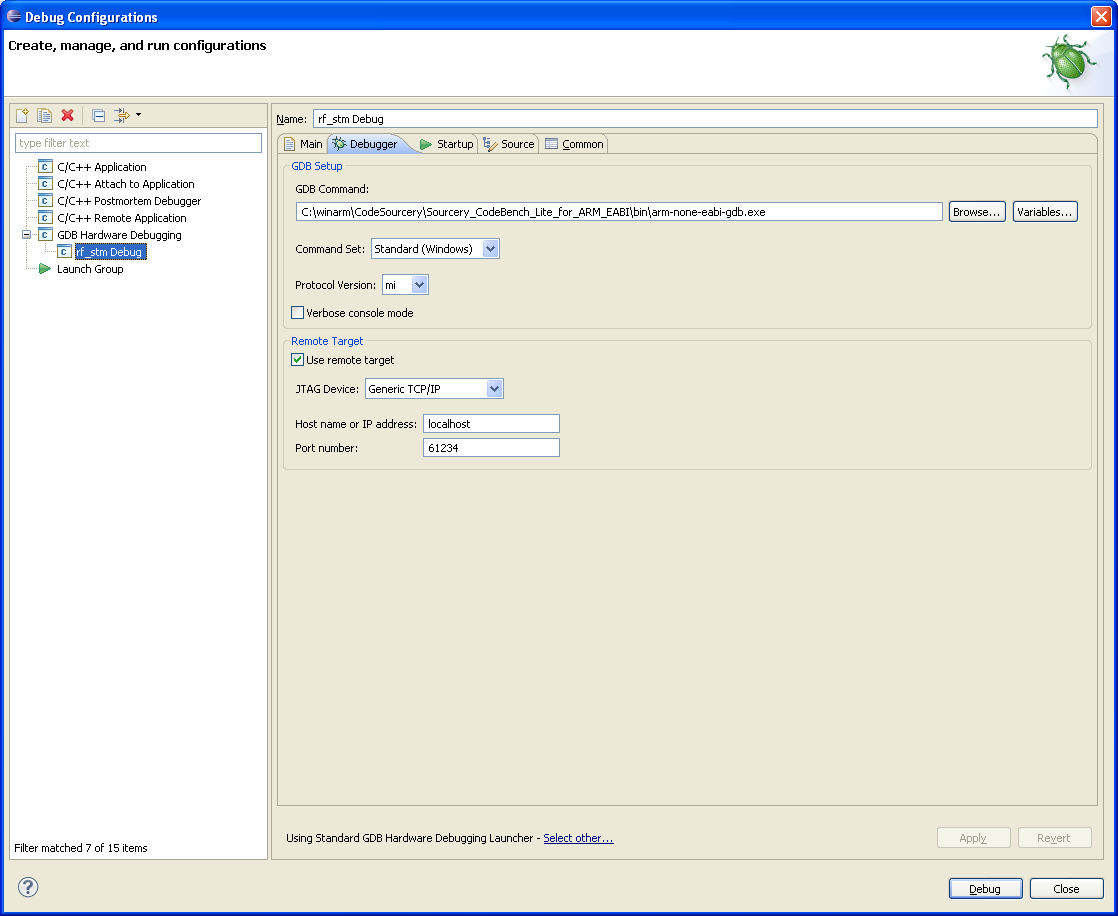
ich hatte Probleme mit dem DSF GDB ich benutze den Standard-GDB Treiber.

siehe Bild. Adib.
Vielen Dank für die Antworten. Die genannten Websites bin ich bereits
mehrmals durchgegangen und die Verwendung des Standard GDB Debuggers
habe ich auch getestet, das Problem bestand leider weiterhin.

Ich habe nun die Kombination aus Atollic ST-Link GDB Server v1.3 pro und
Codesourcery G++ lite 2011.03-42. Das Debugging funktioniert, aber nur
eingeschränkt.
Beim Ausführen(Play) des Programms

while(1)
{
  for(i = 0;i<100000;i++);

  STM_EVAL_LEDToggle(LED1);
  STM_EVAL_LEDToggle(LED2);
}


bekomme ich diese Fehlermeldung im Debug-Panel:

-------
new Debug [GDB Hardware Debugging]
  GDB Hardware Debugger ([Datum & Zeit]) (Suspended) <Error '31' from
remote target>
    Thread [1] (Suspended)
  C:\Program Files\CodeSourcery2\Sourcery G++
Lite\bin\arm-none-eabi-gdb.exe ([Datum & Zeit])
  C:\WIN_E\Indigo\Indigo_WS\new\Debug\new.elf ([Datum & Zeit])
-------

Der ST-Link Debugger läuft scheinbar weiter, da es blinkt. Wenn ich im
Programm ein Breakpoint an die Stelle "STM_EVAL_LEDToggle(LED1);" setze,
kann ich das Programm 2x mit Play durchlaufen, bevor das gleiche Problem
erneut auftritt. Zum Error 31 habe ich leider nichts brauchbares finden
können.

Da sich die Möglichkeit ergeben hat, habe ich jetzt mal die Hardware
getauscht, d.h. neuer ST-Link und neues Board. Das Debugging
funktioniert jetzt problemlos mit o.g. Software. Der Attollic GDB Server
stürzt bei Hardware und Software Resets zwar noch ab (und zeigt da auch
Error 31 an), aber immerhin kann ich jetzt debuggen. Komisch nur, dass
der Atollic ST-Link GDB Server v1.6 pro noch immer nicht funktioniert.
Gutten tag
Ich sprechen nich Deutch....konne sie mich in English antwort bitte...
How did you solve this issue ????
I have the same problem in ECLIPES JUNO
Attolic V1.6.0 Pro and GDB 7.3.1.20121016-cvs


Connecting to the ST-Link Debugger... OK
Waiting for debugger connection...Error while waiting for debugger
connection.
Shutting down...
Debugger connection lost.
Shutting down...

Vielen Dank
Ben
Hello Ben,

recently I bought a olimex olimexino stm32 having stm32f103rbt.

Now I use my toolchain:
- eclipse Juni + cdt + armgcc
- atollic stlinkv2 gdb server

I patch the swd signals from an stm32f4discovery to the stm32f103 board.

I run into the same problem as you the gdb debugger server crashes on
the startup process.

However I tried the same hardware configuration and the same source
using atollic and that works.

It looks there is a problem in the eclispe juno gdb for stm32f103.

my toolchain works for the stm32f4discovery programming.

It costs so much time .... :-(

So if someone has a solution for swd programming stm32f103 devices ...


Adib.
Adib
Yip just as I found, exactly the same issues. I reverted to the openocd
v0.6.0 together with juno and the atollic gdb server. It works as
debugging tool, but no go for the built in GDB tools. I tried Yagarto,
code sourcery, gnu tool etc...... and Yes 2 weeks later... to find all
this out. The ..x64.exe file of the openocd was a problem to find. But
once I got it it worked. It beats paying thousands of ueros for the
atollic tools...which I think they put a bug in just to frustrate the
developers into buying atollic tools ;-)
Tx Ben
Ben BB schrieb:
> Adib
> Yip just as I found, exactly the same issues. I reverted to the openocd
> v0.6.0 together with juno and the atollic gdb server. It works as
> debugging tool, but no go for the built in GDB tools. I tried Yagarto,
> code sourcery, gnu tool etc...... and Yes 2 weeks later... to find all
> this out. The ..x64.exe file of the openocd was a problem to find. But
> once I got it it worked. It beats paying thousands of ueros for the
> atollic tools...which I think they put a bug in just to frustrate the
> developers into buying atollic tools ;-)
Fyi the openocd link
> Tx Ben

http://www.freddiechopin.info/en/download/category/4-openocd
Hi,

sorry for the late answer, had a lot of work.

I managed to solve the problem. As i said, i took the Atollic GDB Server
v1.60 pro. Unfortunately this was the main issue, because this GDB
Server, for whatever reason, seems to be incompatible with the
Codesourcery Toolchain.

My actual working setup is as follows.

Atollic GDB-Server v1.3 Pro
Codesourcery g++-2012.03-87-arm-none-eabi Toolchain
Eclipse Juno


Now Eclipse config.

External Tools Configuration:
- Select the Atollic GDB-Server .exe file
- Select the folder
(Everyting has to be in this File, GDB Server, dll files etc.)
- Arguments: -e -d
(check the .txt File in the GDB-Server folder for more useful arguments)
- No refresh
- No build

Debug Configuration:
- Select Project
- Use standard GDB Hardware Debugging Launcher
- Set the file "arm-none-eabi-gdb.exe" from the Toolchain you installed
in the GDB Command
- Check "Use remote Target" and set host: "localhost" and port: 61234
- Check Reset and Delay: 3 seconds
- Check Halt, Load Image, Load Symbols
- Check Set Breakpoint at: "main"
- Check Resume
- Type in Run Commands: jump Reset_Handler

Done.
Hi FireDog,

kannst Du mir sage, woher du die 1.3er Version des GDB Servers hast. Ich
versuche es mit 1.6 und 1.7 und bekomme das Debuggen nicht zum Laufen.

Danke
Hallo zusammen,

ich programmiere für einen STM32F103 Microcontroller.

Dafür habe ich mir folgende Programmierumgebnung zusammengestellt:
- Eclipse Juno
- Codesourcery G++
- ST-Link GDB server
- ST-Link V2 Debugger

Aufgebaut ist die Umgebung anhand folgender Beschreibung:
https://sites.google.com/site/stm32discovery/open-source-development-with-the-stm32-discovery/setting-up-eclipse-for-stm32-discovery-development
https://sites.google.com/site/stm32discovery/open-source-development-with-the-stm32-discovery/getting-hardware-debuging-working-with-eclipse-and-code-sourcey
http://www.chibios.org/dokuwiki/doku.php?id=chibios:guides:stlink_eclipse

Allerdings hat das Linker-Skript von der Seite einen Fehler, sodass das
Linken abgebrochen wird.
Ich habe deshalb das Atollic TrueSTUDIO-Linker-Skript, welches bei den
ST-Projekten dabei ist, genommen.
Zum Einen erstellt der Compiler eine 131MB große Bin-Datei und zum
Anderen werden Assembler-Dateien (Assembler-Startup-Skript) nicht
compiliert.

Als weiteren Versuch habe ich dann das Linker- und C-Startup-Skript von
M.Thomas verwendet.
Nun wurde eine vernünftige Bin-Datei erstellt.
Das Testprojekt konnte ich mit dem STM32 ST-LINK Utility Tool auf den uC
laden. Das Testprojekt wird auch wie erwartet ausgeführt.
Daher gehe ich davon aus, dass der Code richtig compiliert wurde.

Nun kommen wir zu meinem Problem mit dem Debuggen.

Ich kann mit meiner Programmierumgebung eine Verbindung über den GDB
Server herstellen. Wenn ich dann eine Debug Session starten möchte, bei
der
zuerst der Code auf den uC geladen wird, erhalte ich folgende
Fehlermeldung.

symbol-file
D:\\TECHWORK\\TECHWORK\\trunk\\Firmware\\workspace_for_arm_firmware\\Fw_
Project_Template\\Debug\\Fw_Project_Template
load
D:\\TECHWORK\\TECHWORK\\trunk\\Firmware\\workspace_for_arm_firmware\\Fw_
Project_Template\\Debug\\Fw_Project_Template
You can't do that when your target is `None'


Bei einem weiteren Versuch, kommt die Fehlermeldung ebenfalls; sie wird
aber ignoriert und ein anderer Fehler erscheint zusätzlich.

Target Request failed: Don't know how to run. Try "help target".


Ich habe nach dem Begriff "Target" gegooglet, aber nichts gefunden, was
mir weiter hilft.
Wahrscheinlich liegt es daran, dass ich noch nicht verstanden habe, was
mir die Fehlermeldung sagen will.

Ich hoffe, mir kann hier jemand weiterhelfen.

Viele Grüße
Marco
Coocox.org und die aktuelle IDE nehmen +
gcc-arm-none-eabi-4_6-2012q1-20120316.exe als toolchain.
Bitte melde dich an um einen Beitrag zu schreiben. Anmeldung ist kostenlos und dauert nur eine Minute.
Bestehender Account
Schon ein Account bei Google/GoogleMail? Keine Anmeldung erforderlich!
Mit Google-Account einloggen
Mit Google-Account einloggen
Noch kein Account? Hier anmelden.