Habe nun das Debuggen und Setzen eines Breakpoints direkt in GDB
versucht, z.B. innerhalb des Mainloop in main():
1 | (gdb) break lambda.c:74
|
2 | Haltepunkt 1 at 0x2ae2: file ../lambda.c, line 74.
|
auch hier bleibt dann die Ausführung nach "continue" nicht stehen.

Anscheinend werden also die BREAK Instruktionen nicht eingefügt.

Setze ich mittels inline Assembly manuell einen permanenten Breakpoint
in einer Zeile in der die Ausführung stoppen soll:
bleibt die Ausführung dort stehen:
1 | (gdb) target remote localhost:4242
|
2 | Remote debugging using localhost:4242
|
3 | 0x00000000 in __vectors ()
|
4 | (gdb) continue
|
5 | Continuing.
|
6 |
|
7 | Program received signal SIGTRAP, Trace/breakpoint trap.
|
8 | measure () at ../sensors.c:110
|
9 | 110 asm("break");
|
und ich kann Werte von Variablen ansehen usw. Versuche ich zu steppen,
sagt GDB:
1 | (gdb) next
|
2 | measure () at ../sensors.c:110
|
3 | 110 asm("break");
|
4 | The program is stopped at a permanent breakpoint, but GDB does not know
|
5 | how to step past a permanent breakpoint on this architecture. Try using
|
6 | a command like `return' or `jump' to continue execution.
|
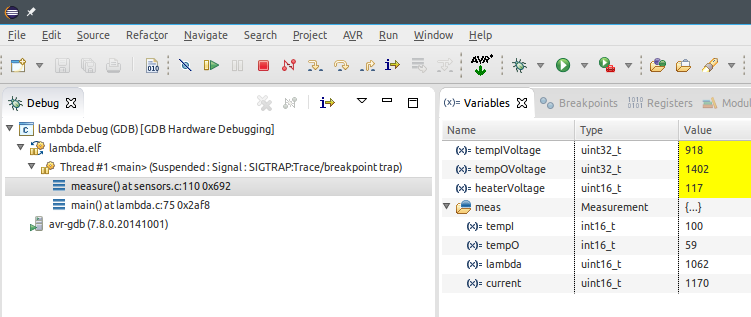
und ich kann mit jump zur nächsten Zeile springen und die Ausführung
fortsetzen. Das funktioniert auch prima in Eclipse (siehe Anhang).

Also jetzt rausfinden, warum die BREAK Instruktion nicht eingefügt
wird..!